Property Cycles

Get on the Cycle
Main points:
- All property markets tend to follow cycles
- cycles differ in there rises and falls, depending on conditions [finance mainly] but tend to follow 18 year cycles
- Sticking to cash flow positive principles, ie property with a positive yield reward from Chapter 4 of our E-Book, it is possible to buy property that fits this criteria in most if not all of the cycle
- The types of property to look for in different parts of the cycle
Introduction
Like capital and equity markets, asset markets like minerals and natural products follow cycles which can be recorded and observed. The property [and to be more precise land] asset class is no different, indeed the cycles here are if anything more defined and predictable.
A commentator from the UK, Fred Harrison is the most famous person to be linked with stating that the residential property market in most mature economies follows a distinct 18 year cycle, 14 years of growth and 4 years of decline. Indeed, Fred Harrison was sage-like in his predictions for the UK market and its crash in 2008-10, speaking of this as early as 1998.
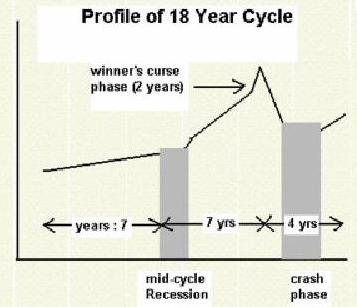
The graph below shows this cycle being played out:
Years 1-7 – growth
Year 7 approx – market “takes a breath” with a mid cycle recession
Year 9-14 – accelerated growth
Year 15-18 – declines
A slightly more detailed graph splits these stages, and gives characteristics to the market in each phase, as follows:

As an investor, do you recognise these cycles in your home market? Well, maybe and maybe not. Certainly the research shows that in markets such as UK and USA the property market really does follow this cycle with alarming accuracy. Indeed research goes back 400 years to prove it to be the case. In other markets such as Japan at the moment for example, you could claim that the cycle is not well-mapped [but in Hong Kong maybe so].
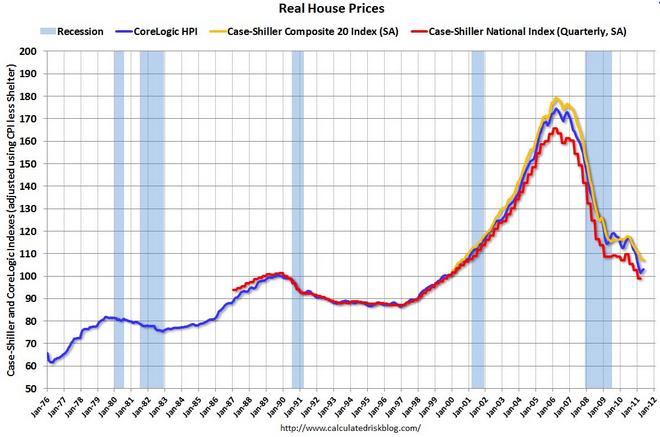
When we look at graphs for UK and USA, the cycle is more clear:
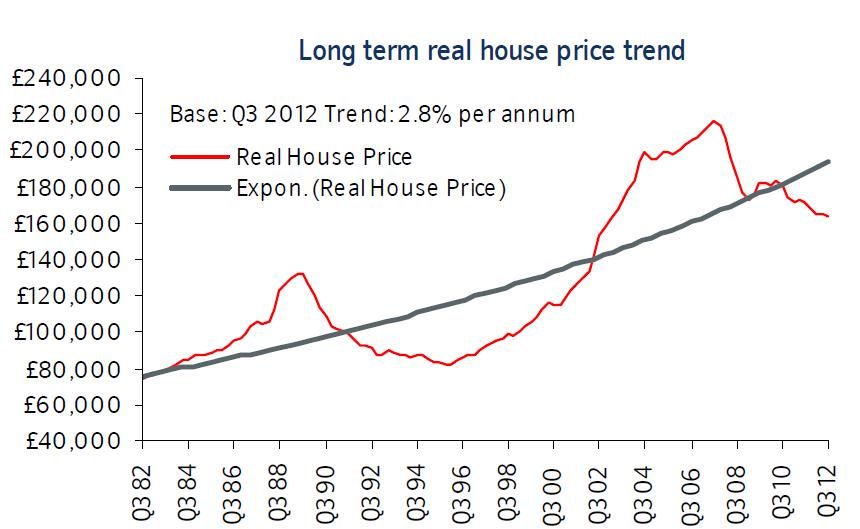
UK House Price Graph – 1982 – 2012
So, the idea is all well and good. If we follow that property markets do tend to follow fairly reliable cycles, then we can start to think about our timing in buying and selling.
Clearly, the old [and not very helpful] “buy low, sell high” principle seems an obvious one to follow. Looking to the UK market for example, a purchaser in the so-called stealth phase of the market in 1995 and a disposal just before the end of the mania phase in 2007 would seem a sensible and obvious strategy to try and replicate. Well, yes I agree! But this approach has a few problems:
- Identifying the buy and sell points in the cycle so precisely is very difficult unless done with hindsight.
- The graph shows average values of the market, certain location and property types will have done better or worse relatively at any given time.
- Waiting for the lowest possible point in the market will mean a very short and infrequent opportunity for you to buy in any given market, even if timed well.
- Much opportunity can be lost trying to time the market exactly right.
So, what can we do with this idea of property cycles to make meaningful and successful investments?
Location, Location, Location
And here we go again, looking to where we are buying and now tying it into the “when” we are buying or selling also. If we think about property grades, in a given city say we can define groups as follows.
Grade Property Quality from A to D:
Grade A – best located property, in a good refurbishment standard
Grade B -average location property in a good condition or Grade A located property in a lower refurbishment standard
Grade C – below average property locations
Grade D – property which is difficult to finance due to poor location or micro location or very bad refurbishment standard. The property may have other blights, such as a sitting tenant on low rent or blighted by new building around it.
An exercise here will be to think of a market you know well, and look to where you think you are in the property cycle right now. Additionally, think about the different grades of property and if possible plot have these have performed in the last 10 years or so. This will be very interesting, and I have done this with a number of markets in UK and Germany to see what thoughts emerge.
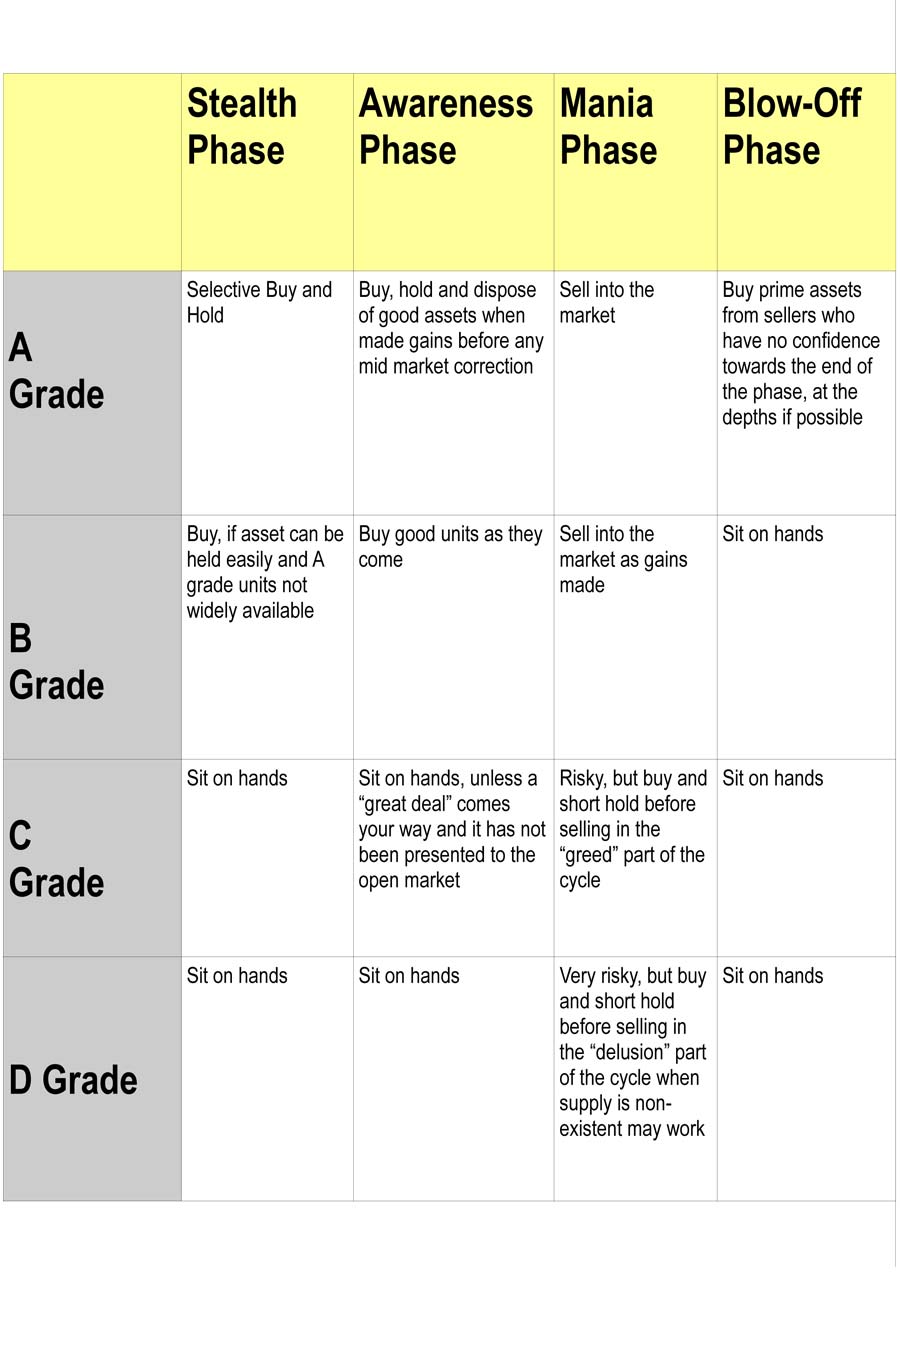
Our findings, using this 4-category approach and the idea of the 4-phases of the 18 year cycle are captured in the table below:
Summary and Conclusion
We have said that the market is seen to follow roughly 18 year cycles, with 4 distinct phases. Looking more closely at the market, we have split the properties within a location down in 4 depending on quality of unit and sub-location, and introduced some ideas as to when these locations support different activity in the cycle as a whole. In each phase of the cycle, there is something to do as an investor, either buying, holding under management or selling off.
And, So What? As we sit here at the start of 2015, what are we doing as investors, where, why and when? Get in touch to find out.